The Federal Reserve dot plot 2026 is grabbing attention from investors, economists, and everyday folks tracking borrowing costs. Released as part of the FOMC’s Summary of Economic Projections (SEP) in December 2025, this visual tool shows individual policymakers’ anonymous forecasts for the federal funds rate. Right now, with the rate holding steady at 3.5%–3.75% after late-2025 cuts, many are asking: how does this tie into when will the Federal Reserve cut interest rates again in 2026? Let’s unpack the latest dot plot, what it signals, and why it matters in plain language.
What Exactly Is the Federal Reserve Dot Plot?
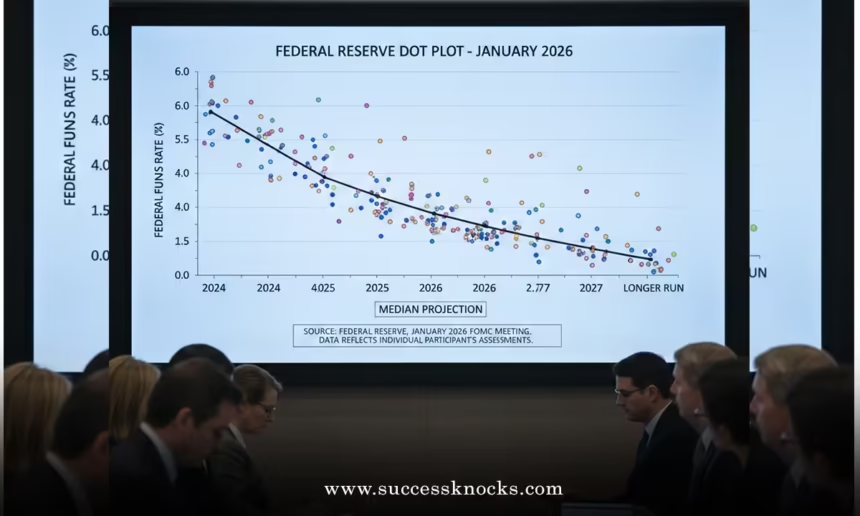
Picture a scatter plot where each dot represents one FOMC participant’s best guess for where the federal funds rate should end up at year-end for coming years. There are 19 participants (Board members plus regional bank presidents), though only some vote at each meeting—all submit projections.
The dot plot isn’t a promise or a vote tally. It’s more like a crowd-sourced map of thinking inside the Fed. The median dot (the middle value) often gets the most headlines because it hints at the committee’s collective leanings.
This tool debuted in 2012 to add transparency. Before that, markets guessed blindly about future policy. Now, every quarter (or so), we get this snapshot alongside economic forecasts for GDP, unemployment, and inflation.
Think of it as the Fed’s version of a family group chat poll: everyone chimes in, but the median opinion usually guides the conversation.
Decoding the Latest Federal Reserve Dot Plot 2026 Projections
The December 10, 2025, SEP provides the most recent view. The median projection for the federal funds rate at the end of 2026 sits at 3.4% (implying a target range around 3.25%–3.5%). That’s unchanged from the September outlook.
What does this mean practically? Starting from the current 3.5%–3.75% range, the median path points to roughly one 25-basis-point cut during 2026. No aggressive easing here—just a modest step lower.
For context:
- 2027 median: Around 3.1% (another single cut implied).
- Longer-run neutral rate: Still clustered near 3.0%.
The spread of dots tells a story too. Some participants see no cuts in 2026 (hawkish hold), while others pencil in more easing (one outlier even as low as 2.0%–2.25%). Seven or so signaled zero reductions next year in the latest plot.
This caution reflects confidence: the economy isn’t screaming for help. Growth looks solid, jobs stable, inflation cooling but sticky.
For deeper details, check the official Federal Reserve Summary of Economic Projections.
Key Economic Assumptions Behind the Federal Reserve Dot Plot 2026
The dot plot doesn’t float in isolation—it ties to broader forecasts.
- Real GDP growth: Upped to 2.3% for 2026 (from 1.8% previously). Some of this bump comes from timing shifts (like government shutdown effects pushing activity into early 2026), but it signals resilience.
- Unemployment: Steady at 4.4% by year-end 2026. Near full employment—no red flags.
- Core PCE inflation: Down to 2.5% in 2026 (slightly better than prior 2.6%). Still above the 2% target, explaining the reluctance for big cuts.
These numbers suggest policymakers feel they’ve reached a “neutral” zone where policy neither boosts nor brakes too hard. Chair Powell emphasized this post-December meeting: the Fed can now “wait and see.”
It’s like driving on a clear highway—you don’t slam the brakes unless something jumps out.
How the Federal Reserve Dot Plot 2026 Influences When Will the Federal Reserve Cut Interest Rates Again in 2026
The big question everyone circles back to: when will the Federal Reserve cut interest rates again in 2026?
The dot plot’s median implies perhaps mid-to-late year for that single cut—if data cooperates. No rush early on, especially with inflation not fully tamed and growth holding up.
Markets sometimes disagree. Bond futures (via CME FedWatch) often price in one to two cuts, potentially totaling 50 basis points. That’s a bit more dovish than the Fed’s median.
Why the gap? The Fed prioritizes actual data over market wishes. If jobs soften or inflation drops faster, cuts could come sooner. If tariffs or fiscal policies heat prices, they might delay or skip.
Dissenting votes in recent meetings (three in December) highlight divisions—some want faster easing, others none at all.
Bottom line: the Federal Reserve dot plot 2026 leans patient. Expect holds through early meetings (like January), with any action likely back-loaded if conditions warrant.
What Could Change the Federal Reserve Dot Plot 2026 Outlook?
Projections evolve. The next SEP (March 2026?) could shift based on fresh data.
Upside risks to inflation (tariffs, wage pressures) might keep dots higher. Downside risks (labor market cooling, global slowdown) could pull them lower.
Leadership matters too—Jerome Powell’s term ends mid-2026, and a new chair could influence tone.
External shocks always lurk. The plot is a snapshot, not destiny.
Why You Should Care About the Federal Reserve Dot Plot 2026
This chart ripples through your wallet. A cautious plot means:
- Mortgage and loan rates stay elevated longer.
- Savings yields remain attractive a bit more.
- Stock markets might trade sideways if cuts disappoint.
For borrowers eyeing refis or businesses planning expansion, the Federal Reserve dot plot 2026 signals “not yet” on big relief. Savers, enjoy the pause.
Track updates via reliable sources like the CME FedWatch Tool or J.P. Morgan Research insights.
Wrapping Up: The Federal Reserve Dot Plot 2026 Signals Caution, Not Urgency
The Federal Reserve dot plot 2026 paints a picture of measured easing—one modest cut likely, keeping the federal funds rate around 3.25%–3.5% by year-end. Tied to solid growth, stable jobs, and gradual inflation progress, it answers when will the Federal Reserve cut interest rates again in 2026 with “probably later, and only if needed.” The Fed’s in wait-and-see mode, ready to adjust but not eager to rush.
Stay data-focused: watch jobs reports, CPI/PCE reads, and FOMC statements. Understanding this tool empowers smarter decisions on loans, investments, and savings. The economy’s resilient—policy will follow suit.
FAQs
1. What does the median projection in the Federal Reserve dot plot 2026 say about the federal funds rate?
The December 2025 median shows about 3.4% by end-2026, suggesting one 25-basis-point cut from current levels.
2. How does the Federal Reserve dot plot 2026 relate to when will the Federal Reserve cut interest rates again in 2026?
It implies any cut likely comes mid-to-late year, with many participants favoring holds unless data weakens significantly.
3. Why is there variation in the dots on the Federal Reserve dot plot 2026?
Participants differ on inflation risks, growth strength, and policy needs—some see no cuts, others more easing.
4. Will the Federal Reserve dot plot 2026 change soon?
Yes, the next update (March 2026) could shift based on incoming economic data like jobs and inflation reports.
5. Where can I view the latest Federal Reserve dot plot 2026?
Directly from the Federal Reserve’s website in the Summary of Economic Projections, released quarterly after FOMC meetings.