

Did you know that increasing customer retention by just 5% can boost profits by 25% to 95%? For mid-market B2B companies, understanding and proactively managing customer health isn’t just a good idea – it’s crucial for sustainable growth and profitability. This comprehensive guide will walk you through the best customer health score metrics for mid-market B2B companies, helping you identify at-risk accounts, unlock expansion opportunities, and foster long-term customer relationships. By the end, you’ll have a clear roadmap to building a robust health scoring system tailored to your unique business needs in 2026.
Table of Contents
- Understanding Customer Health Scores
- What is a Customer Health Score?
- Why Mid-Market B2B Needs Robust Health Scores
- The Pitfalls of a One-Size-Fits-All Approach
- The Core Pillars of Customer Health
- Essential Customer Health Score Metrics for Mid-Market B2B (Deep Dive)
- Product Usage & Adoption Metrics
- Engagement & Satisfaction Metrics
- Financial & Value Realization Metrics
- Relationship & Support Metrics
- Building Your Mid-Market B2B Customer Health Score Model
- Defining Your “Healthy” Customer
- Weighting Metrics: A Strategic Approach
- Data Collection & Integration
- Tools and Platforms for Health Scoring
- Implementing and Iterating Your Health Score
- Establishing Baselines and Tiers
- Actionable Insights: Turning Scores into Strategy
- Regular Review and Adjustment
- Training Your Customer Success Team
- A 7-Step Framework for a Robust B2B Health Score
- Step 1: Define Your Goals
- Step 2: Identify Key Metrics
- Step 3: Assign Weights
- Step 4: Establish Scoring Logic
- Step 5: Choose Your Tools
- Step 6: Implement & Monitor
- Step 7: Iterate & Refine
- Common Challenges and How to Overcome Them
- Data Silos
- Subjectivity
- Lack of Executive Buy-in
- Over-complication
- The Future of Customer Health Scoring in 2026
- Conclusion
- FAQ
Understanding Customer Health Scores

In the competitive landscape of 2026, simply acquiring customers isn’t enough. You need to keep them, grow them, and turn them into advocates. This is where a customer health score comes in.
What is a Customer Health Score?
A customer health score is a quantitative measure designed to indicate the overall well-being and future potential of a customer account. It’s a composite score, usually a single number or a tiered rating (e.g., green, yellow, red), derived from analyzing various data points related to a customer’s interaction with your product or service. Think of it like a medical check-up for your customer accounts – it helps you diagnose potential issues before they become critical. For mid-market B2B companies, this score is invaluable for predicting churn, identifying upsell opportunities, and guiding proactive customer success efforts.
Why Mid-Market B2B Needs Robust Health Scores
Mid-market B2B companies often sit in a unique position. You likely have a significant number of accounts, but perhaps not the massive scale of enterprise operations, meaning each customer relationship carries substantial weight. Losing even a few key clients can severely impact your bottom line. Robust customer health score metrics for mid-market B2B are essential for several reasons:
- Proactive Churn Prevention: The most obvious benefit. By identifying declining health early, your customer success team can intervene before a customer decides to leave. This shifts your strategy from reactive firefighting to proactive relationship management.
- Identifying Expansion Opportunities: Healthy customers are often ripe for expansion. A high health score can signal that an account is ready for an upsell, cross-sell, or increased usage, contributing directly to your revenue growth.
- Resource Prioritization: With limited resources, you need to know where to focus your customer success efforts. Health scores help prioritize accounts that need immediate attention (red) versus those that are thriving (green).
- Measuring Customer Success Impact: Health scores provide a quantifiable way to track the effectiveness of your customer success initiatives over time. Are your strategies truly improving customer well-being?
- Enhanced Customer Experience: By understanding what makes a customer “healthy,” you can tailor your product development, support, and engagement strategies to better meet their needs, leading to a superior overall experience.
The Pitfalls of a One-Size-Fits-All Approach
Attempting to use enterprise-level health scoring models or overly simplistic metrics designed for small businesses will likely fail in the mid-market B2B space. Enterprise clients often have dedicated teams, complex integrations, and multi-year contracts, while small businesses might focus on basic product usage. Mid-market companies need a nuanced approach that considers:
- Account Complexity: Mid-market accounts can be complex, with multiple users, departments, and stakeholders, but typically less so than large enterprises.
- Contract Value: Each account represents significant revenue, making retention critical.
- Relationship Depth: Personal relationships with key stakeholders are often more impactful than in larger, more impersonal enterprise accounts.
- Product Fit: How well your solution integrates and performs within their existing tech stack and workflows.
Therefore, selecting the right customer health score metrics for mid-market B2B is paramount to creating a system that truly reflects the reality of your customer base.
The Core Pillars of Customer Health
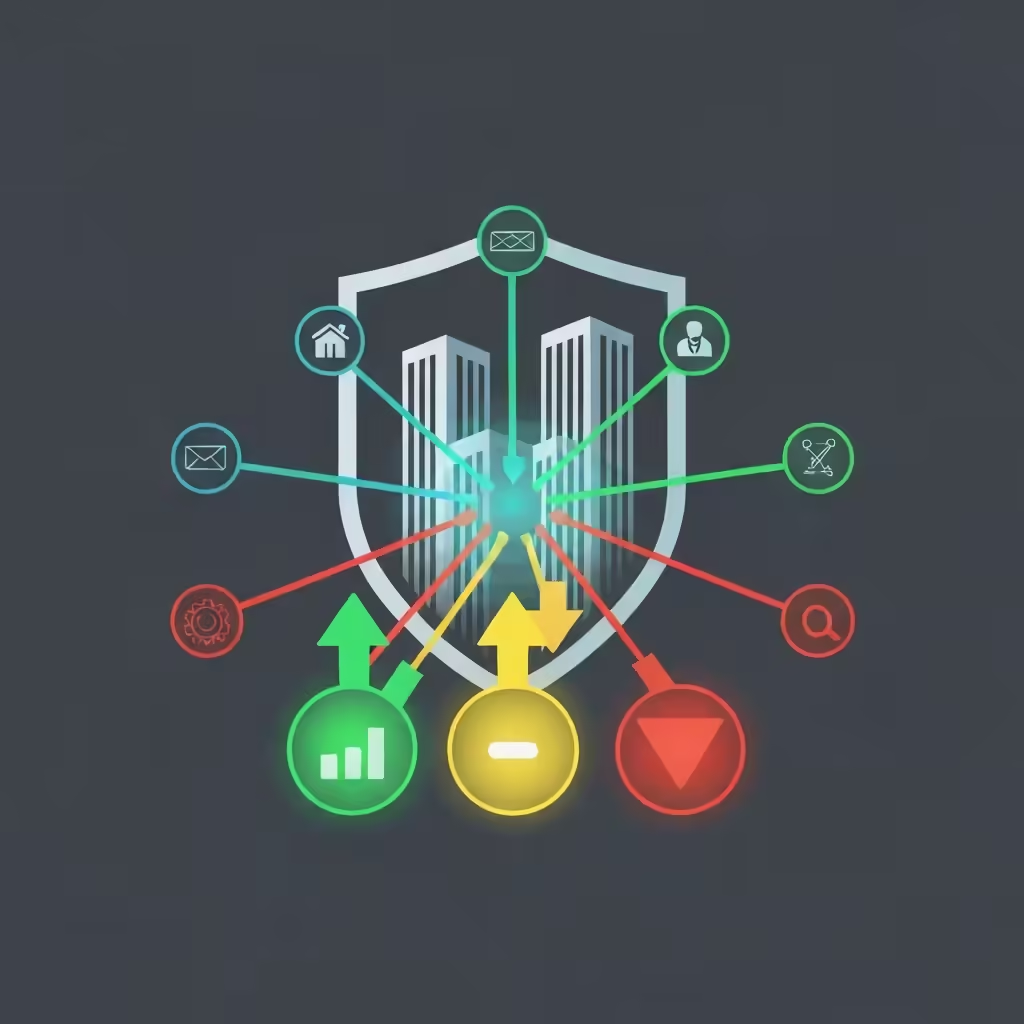
Before diving into specific metrics, it’s helpful to categorize them into core pillars that represent different facets of customer health. These pillars provide a holistic view and ensure you’re not missing critical signals. For mid-market B2B, we typically look at four main areas:
- Product Usage & Adoption: How actively and deeply is the customer using your product/service? Are they leveraging key features?
- Engagement & Satisfaction: How satisfied is the customer with your product, service, and overall relationship? Are they actively interacting with your brand?
- Financial & Value Realization: Is the customer realizing value from your solution? Are they likely to renew or expand their contract?
- Relationship & Support: What is the quality of the human relationship with your team? How effectively are their support needs being met?
By building your health score around these pillars, you create a balanced and comprehensive assessment of each customer’s well-being.
Essential Customer Health Score Metrics for Mid-Market B2B (Deep Dive)
Now, let’s explore the specific customer health score metrics for mid-market B2B that you should consider integrating into your scoring model. Remember, not every metric will be relevant for every business, so choose those that best reflect your product, service, and customer journey.
Product Usage & Adoption Metrics
These metrics reveal how much value your customers are extracting from your product. High usage generally correlates with high value and lower churn risk.
1. Login Frequency & Recency
- What it is: How often users log into your platform (frequency) and when they last logged in (recency).
- Why it matters: A fundamental indicator of engagement. Declining login frequency or a long period since the last login are major red flags. For B2B, this often means the product isn’t embedded in their daily workflow.
- How to measure: Track daily, weekly, or monthly active users (DAU/WAU/MAU) at the account level, and monitor the last login date for key users.
Example:* If a mid-market client with 50 licensed users typically logs in 200 times a week, and that drops to 50, it’s a clear sign of disengagement.
2. Feature Adoption Rate (Key Features)
- What it is: The percentage of key features within your product that a customer’s users are actively utilizing. Focus on features that deliver significant value.
- Why it matters: Customers who use more core features are likely getting more value and are more “sticky.” If they’re only using a fraction of what they pay for, they might question the ROI.
- How to measure: Identify your “stickiest” or most impactful features. Track how many of these features are used by at least one user within the account over a given period.
Example:* For a CRM, this might be tracking the use of sales forecasting, marketing automation, and customer service ticketing modules.
3. Depth of Usage (Time Spent, Actions Taken)
What it is: Beyond simply logging in, how deeply* are users interacting? This includes metrics like time spent in the application, the number of reports generated, data points entered, or complex workflows completed.
- Why it matters: This metric provides qualitative context to frequency. A user might log in daily but only spend 5 minutes, indicating superficial use. Deeper engagement suggests the product is integral to their operations.
- How to measure: Track session duration, specific action counts (e.g., “created 15 projects,” “ran 10 reports”), or the completion of advanced tasks.
Example:* A project management tool might track the number of tasks assigned, comments made, and files uploaded per project.
4. User Growth within Account
- What it is: The trend of adding new users or licenses within an existing customer account over time.
- Why it matters: Organic user growth is a strong indicator of satisfaction and value realization. It suggests the product is spreading internally and becoming more embedded. It also signals potential for upsell.
- How to measure: Compare current active user count/licenses to the initial or previous period’s count.
Example:* If a client started with 10 users and now has 15, it implies positive internal adoption and growth.
Engagement & Satisfaction Metrics
These metrics gauge how satisfied your customers are and how actively they engage with your brand beyond just product usage.
5. NPS (Net Promoter Score)
- What it is: A widely used metric that measures customer loyalty and willingness to recommend your product/service. Customers rate their likelihood to recommend on a scale of 0-10.
- Why it matters: A high NPS indicates strong satisfaction and potential for advocacy. Low scores highlight dissatisfaction and churn risk. It’s a key sentiment indicator.
- How to measure: Conduct regular NPS surveys (in-app, email). Classify respondents as Promoters (9-10), Passives (7-8), or Detractors (0-6). NPS = % Promoters – % Detractors.
Example:* A mid-market B2B software company might send NPS surveys quarterly to key account stakeholders.
6. CSAT (Customer Satisfaction Score) & CES (Customer Effort Score)
- What it is: CSAT measures satisfaction with a specific interaction (e.g., after a support ticket, a training session). CES measures how much effort a customer had to exert to get a problem solved or a request fulfilled.
- Why it matters: These provide granular feedback on specific touchpoints. High CSAT/low CES indicate efficient and pleasant experiences, contributing to overall health.
- How to measure: Short, contextual surveys after specific interactions. “How satisfied were you with this support interaction?” (1-5 scale) or “How easy was it to resolve your issue today?” (1-7 scale).
Example:* After a customer finishes an onboarding module, you might ask for their CSAT on the process.
7. Survey Participation Rates & Open-Ended Feedback
- What it is: The percentage of customers who respond to your surveys (NPS, CSAT, product feedback) and the quality/quantity of open-ended comments they provide.
- Why it matters: Non-response can be a warning sign. Engaged customers are more likely to provide feedback. Analyzing open-ended comments reveals deeper insights into sentiment and specific pain points or delights.
- How to measure: Track response rates for all surveys. Qualitatively review comments for themes and sentiment.
Example:* A sudden drop in survey response rates from a typically engaged account could indicate fading interest.
Financial & Value Realization Metrics
These metrics focus on the commercial aspects of the relationship and whether the customer perceives ongoing value for their investment.
8. Renewal Rate & Churn Risk Indicators
- What it is: The likelihood of a customer renewing their contract. Churn risk indicators include late payments, contract negotiations, or negative sentiment during renewal discussions.
- Why it matters: The ultimate financial health metric. Proactively tracking renewal status and identifying churn risks is paramount for mid-market B2B revenue stability.
- How to measure: Monitor contract end dates, payment history, and flags from account managers regarding renewal conversations.
Example:* A customer consistently paying late or repeatedly asking for discounts during renewal discussions shows a clear financial risk.
9. Expansion Opportunities (Upsell/Cross-sell Potential)
- What it is: The potential for a customer to purchase additional products, services, or higher-tier plans.
- Why it matters: Healthy customers are not just retained; they grow. Identifying expansion potential contributes significantly to account lifetime value and overall company growth.
- How to measure: Look for indicators like increased user growth, frequent use of specific features that hint at needing more advanced functionality, or inquiries about other product lines. Your account managers will often have the best insights here.
Example:* A client maximizing their current storage limits in your cloud service is a prime candidate for an upsell to a higher storage plan.
10. Value Realization (ROI, Achieved Goals)
- What it is: Whether the customer is achieving the business outcomes they hoped for when they purchased your solution. This is often tied to the initial goals set during sales or onboarding.
- Why it matters: If customers aren’t seeing tangible ROI or achieving their strategic objectives with your product, they won’t stick around. This is the core of B2B value.
- How to measure: Periodically review initial success metrics with the customer (e.g., “reduce operational costs by X,” “increase sales leads by Y”). Track benchmarks and progress towards these goals.
Example:* A marketing automation platform might track the number of leads generated, conversion rates, or time saved on manual tasks for a client.
Relationship & Support Metrics
These metrics assess the strength of the human connection and the effectiveness of your support infrastructure.
11. Executive Sponsorship & Champion Engagement
- What it is: The presence and engagement level of a senior executive or key decision-maker within the customer account who champions your solution internally.
- Why it matters: Executive sponsors provide strategic alignment and are crucial for securing renewals and driving adoption at higher levels. Losing a champion can make an account vulnerable.
- How to measure: Track frequency of executive-level meetings, participation in QBRs (Quarterly Business Reviews), and qualitative feedback from your account manager.
Example:* If your account manager hasn’t met with the client’s VP of Operations in over a year, despite previous regular meetings, it could indicate a weakening relationship.
12. Support Ticket Volume & Resolution Time
- What it is: The number of support tickets an account logs and the average time it takes to resolve those issues.
Why it matters: A sudden spike in tickets can indicate product issues or user frustration. Consistently slow resolution times lead to dissatisfaction. However, a complete absence* of tickets can also be a red flag, meaning they might not be using the product or have given up on getting help.
- How to measure: Utilize your helpdesk system to track these metrics per account.
Example:* A mid-market client usually logs 5 tickets a month with a 2-hour average resolution. If they suddenly log 20 tickets with a 10-hour average resolution, their health is declining.
13. Sentiment Analysis (Calls, Emails, Surveys)
- What it is: Analyzing the tone and emotion expressed in customer communications (support calls, emails, open-ended survey responses).
- Why it matters: Provides qualitative insight into customer feelings beyond simple scores. Helps identify frustration, enthusiasm, or indifference.
- How to measure: Use AI-powered sentiment analysis tools or manual review by customer success managers.
Example:* A customer success manager notes increasing frustration in emails from a key contact, even if product usage is still high.
14. Account Manager Interactions/Touchpoints
- What it is: The frequency and quality of interactions between your customer success manager (CSM) or account manager and the client.
- Why it matters: Consistent, valuable interactions build trust and allow your team to proactively address issues and identify opportunities. Lack of engagement from either side is a concern.
- How to measure: Track logged calls, emails, meetings, and QBRs in your CRM. Qualitatively assess the value of these interactions.
Example:* If a CSM hasn’t had a substantive conversation with a key mid-market client in two months, it’s a gap in relationship management.
15. Advocacy (Testimonials, Referrals)
- What it is: A customer’s willingness to act as a reference, provide a testimonial, or refer new business to you.
- Why it matters: Advocates are your healthiest, most satisfied customers. They are unlikely to churn and are powerful drivers of new business.
- How to measure: Track successful referrals, participation in case studies, public testimonials, or willingness to be a reference.
Example:* A customer who enthusiastically agrees to participate in a case study is a strong indicator of excellent health.
Building Your Mid-Market B2B Customer Health Score Model
Now that you have a comprehensive list of potential customer health score metrics for mid-market B2B, it’s time to construct your own model. This isn’t a “set it and forget it” process; it requires thoughtful design and ongoing refinement.
Defining Your “Healthy” Customer
Before you can score health, you need to clearly define what a “healthy” customer looks like for your business. This involves:
- Ideal Customer Profile (ICP): What are the characteristics of your most successful, long-term customers? What industry are they in? What size are they?
- Success Milestones: What are the key achievements a customer should reach (e.g., completing onboarding, adopting 3 core features, achieving specific ROI)?
- Behavioral Benchmarks: What does ideal product usage look like? How often do they engage with your team?
In 2026, data from your CRM and product analytics tools can help you identify patterns among your most valuable customers.
Weighting Metrics: A Strategic Approach
Not all metrics are created equal. Some indicators are more critical to your business than others. You’ll need to assign weights to each metric based on its predictive power for churn or growth.
- High Weight: Metrics highly correlated with churn or renewal (e.g., product adoption of core features, executive engagement, value realization).
- Medium Weight: Important but less immediate indicators (e.g., NPS, support ticket volume).
- Low Weight: Supporting indicators (e.g., general website activity, forum participation).
For instance, for a SaaS company, core product usage might carry 40% of the score, while support interactions are 15%. This weighting ensures your customer health score metrics for mid-market B2B accurately reflect what truly matters.
Data Collection & Integration
The biggest challenge for many mid-market B2B companies is consolidating data from various sources: your CRM, product analytics, support desk, marketing automation, and accounting systems.
- Centralize Data: Aim to bring all relevant data into a single platform or data warehouse. This might involve integrations between your existing tools.
- Automate as Much as Possible: Manual data entry is prone to error and time-consuming. Leverage APIs and connectors to automate data flow.
- Ensure Data Accuracy: Garbage in, garbage out. Regularly audit your data for accuracy and consistency.
Tools and Platforms for Health Scoring
While you can start with spreadsheets, dedicated customer success platforms are invaluable for mid-market B2B companies looking to scale their health scoring efforts. These tools can:
- Automate data collection and aggregation.
- Calculate health scores based on your defined rules and weights.
- Provide dashboards and reporting for easy visualization.
- Trigger alerts for at-risk accounts.
- Help manage customer success playbooks.
Consider platforms like Gainsight, ChurnZero, or Catalyst, which are specifically designed for customer success operations.
Implementing and Iterating Your Health Score
Once your model is built, the real work begins: putting it into practice and continuously refining it.
Establishing Baselines and Tiers
Start by categorizing your accounts into health tiers (e.g., Green: Healthy, Yellow: At-Risk, Red: Critical). Define the score ranges for each tier based on historical data and your “healthy customer” definition.
- Green: Proactive engagement, potential for growth.
- Yellow: Requires attention, potential issues emerging.
- Red: Immediate intervention needed, high churn risk.
These tiers give your team clear actionable thresholds.
Actionable Insights: Turning Scores into Strategy
A health score is useless if it doesn’t lead to action. For each tier, develop specific playbooks or strategies for your customer success team.
- Green Accounts: Focus on advocacy, expansion, and deeper value realization. Schedule QBRs.
- Yellow Accounts: Proactive outreach, value reinforcement, identify pain points, offer training.
- Red Accounts: Immediate executive-level intervention, root cause analysis, dedicated recovery plan.
This ensures your team knows exactly what to do when they see a change in a customer’s health. You can find more strategies in our guide on Maximizing Customer Lifetime Value.
Regular Review and Adjustment
Your business, product, and customer needs evolve. Your health score model should too.
- Monthly/Quarterly Review: Regularly meet with your customer success, product, and sales teams to discuss the accuracy and effectiveness of your scores.
- Analyze Churn & Renewal Data: When a customer churns, review their historical health score. Did the score accurately predict the churn? If not, why?
- Adjust Weights & Metrics: Based on your reviews, tweak metric weights, add new metrics, or remove irrelevant ones. What made sense in 2024 might not be as relevant in 2026.
Training Your Customer Success Team
Your CSMs are on the front lines. They need to understand:
- What the health score means: How it’s calculated and what each metric represents.
- How to use it: How to interpret scores, identify trends, and trigger appropriate actions.
- Their role in impacting it: How their daily activities contribute to improving customer health.
Ongoing training and clear communication are vital for successful implementation of your customer health score metrics for mid-market B2B.
A 7-Step Framework for a Robust B2B Health Score
To help you put it all together, here’s a practical framework for developing your own customer health score.
Step 1: Define Your Goals
What do you want to achieve with a health score? (e.g., reduce churn by X%, increase upsells by Y%, improve customer satisfaction). Clearly defined goals will guide your metric selection and weighting.
Step 2: Identify Key Metrics
Based on your goals and the pillars of customer health, brainstorm a comprehensive list of potential customer health score metrics for mid-market B2B relevant to your business. Don’t be afraid to start broad and narrow down later.
Step 3: Assign Weights
For each selected metric, determine its relative importance in predicting customer success or failure. Assign a percentage weight, ensuring the total adds up to 100%. Consider creating different weights for different customer segments if applicable.
Step 4: Establish Scoring Logic
For each metric, define how it contributes to the overall score. This could be:
- Threshold-based: If login frequency > X, score is Y; else score is Z.
- Graded scale: 1-5 points based on performance.
- Boolean: Yes/No (e.g., “Has an executive sponsor?”).
Combine these individual metric scores using your assigned weights to produce a single health score.
Step 5: Choose Your Tools
Decide whether you’ll start with a spreadsheet, use your existing CRM capabilities, or invest in a dedicated customer success platform. Consider your current resources and future scalability.
Step 6: Implement & Monitor
Set up the data integrations, configure your scoring model, and launch it. Begin collecting data and monitoring the scores. This initial phase is about getting the system running and identifying any immediate data quality issues.
Step 7: Iterate & Refine
This is an ongoing process. Regularly review your health score’s accuracy and predictive power. As your product evolves, your customer base changes, or new insights emerge, be prepared to adjust your metrics, weights, and scoring logic. A health score is a living tool.
Common Challenges and How to Overcome Them
Implementing customer health score metrics for mid-market B2B isn’t without its hurdles. Here are some common challenges and strategies to overcome them.
Data Silos
- Challenge: Relevant customer data is spread across multiple systems (CRM, support, product, billing) and doesn’t communicate.
- Solution: Invest in integration tools or a customer success platform that can pull data from various sources. Prioritize getting your most critical data points connected first. Consider a data warehouse strategy for long-term scalability.
Subjectivity
- Challenge: Over-reliance on qualitative, subjective input from CSMs, leading to inconsistent scoring.
- Solution: While qualitative input is valuable, balance it with quantifiable metrics. Provide clear guidelines and training for CSMs on how to assess subjective factors and ensure consistency. Use sentiment analysis tools to add objectivity.
Lack of Executive Buy-in
- Challenge: Leadership doesn’t understand the value of health scoring or doesn’t allocate necessary resources.
- Solution: Clearly articulate the business impact: reduced churn, increased revenue, better resource allocation. Present compelling data and case studies (even internal ones) demonstrating how health scores directly contribute to strategic goals. Start small, prove value, then scale.
Over-complication
- Challenge: Trying to track too many metrics or building an overly complex scoring model that’s hard to maintain or understand.
- Solution: Start simple. Focus on 5-7 core metrics that are highly predictive. You can always add more complexity later. Ensure your model is transparent and easy for your team to understand and act upon. Prioritize impact over exhaustive detail. You can learn more about streamlining your customer processes by checking out our resource on Efficient Customer Onboarding Strategies.
The Future of Customer Health Scoring in 2026
As we look ahead in 2026, customer health scoring is becoming even more sophisticated. Expect to see:
- Advanced AI and Machine Learning: AI will play an increasingly significant role in predictive analytics, identifying subtle patterns in customer behavior that indicate churn risk or expansion potential long before humans can.
- Hyper-Personalization: Health scores will move beyond a single number to offer personalized insights and recommended actions tailored to individual customer segments or even specific users within an account.
- Real-time Health Updates: As data integration becomes more seamless, health scores will update in near real-time, allowing for immediate intervention.
- Proactive Prescriptive Analytics: Instead of just identifying problems, systems will increasingly recommend specific, actionable steps to improve customer health, automating playbooks and workflows.
Embracing these advancements will be key for mid-market B2B companies to stay competitive and provide exceptional customer experiences.
Conclusion
Implementing a robust customer health score system is no longer a luxury but a


